In this post I talk about an unexpected finding from 2021, discovered while rearchitecting and benchmarking a backend API running on DigitalOcean.
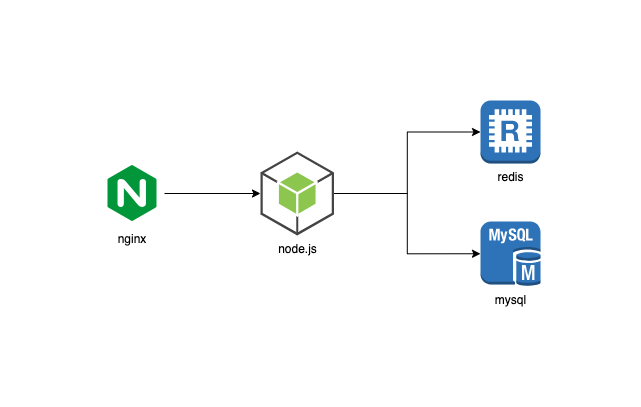
The starting point was an expressjs app running on a Digital Ocean droplet:
Before making any changes I do the initial benchmark to establish the baseline and got about 10 req/sec throughput.
After a couple of rounds of optimizations the throughput went up to 100 rps. Good but not enough.
Eventually I figured a way to replace MySQL and Redis with plain files and keep everything in memory. Excited about possible blazing performance I was shocked when the next benchmark reported ~300 rps. What am I missing here 🤔 Ah, perhaps nginx wasn’t properly configured, so a round of tuning but still no major improvements. What else to try now? With no new ideas I went to bed.
The first thing that came to mind when I woke up was hey let’s try AWS. Quickly spin up a new EC2 with similar resources and run a test:
$ ./wrk –latency -t10 -c1000 -d30s ‘http://my-api/endpoint’
Running 30s test
10 threads and 1000 connections
Thread Stats Avg Stdev Max +/- Stdev
Latency 481.52ms 211.37ms 1.87s 61.73%
Req/Sec 207.61 49.19 464.00 73.68%
60779 requests in 30.09s, 121.22MB read
Requests/sec: 2019.81
Wow, 2000 rps, compared to 300 on DigitalOcean, what the heck. At this moment DigitalOcean looks suspicious, so in order to test this hypothesis I tested nginx serving a static file on DO and AWS:
An nginx benchmark on an AWS c5.xlarge instance (no config tweaks):
$ ./wrk --latency -t10 -c300 -d30s 'http://MY_EC2_IP'
Running 30s test @ http://MY_EC2_IP
  10 threads and 300 connections
  Thread Stats   Avg      Stdev     Max   +/- Stdev
    Latency    40.32ms    2.39ms 288.38ms   98.00%
    Req/Sec   739.19     43.71     0.91k    83.03%
  220828 requests in 30.04s, 180.89MB read
Requests/sec:   7351.19
Same test but nginx running on a 80$ DigitalOcean droplet:
./wrk --latency -t10 -c300 -d30s 'http://MY_DROPLET_IP'
Running 30s test @ http://MY_DROPLET_IP
  10 threads and 300 connections
  Thread Stats   Avg      Stdev     Max   +/- Stdev
    Latency   704.66ms  224.93ms   2.00s    90.89%
    Req/Sec    44.66     29.67   290.00     73.40%
  12426 requests in 30.05s, 132.32MB read
112
Requests/sec:    413.54
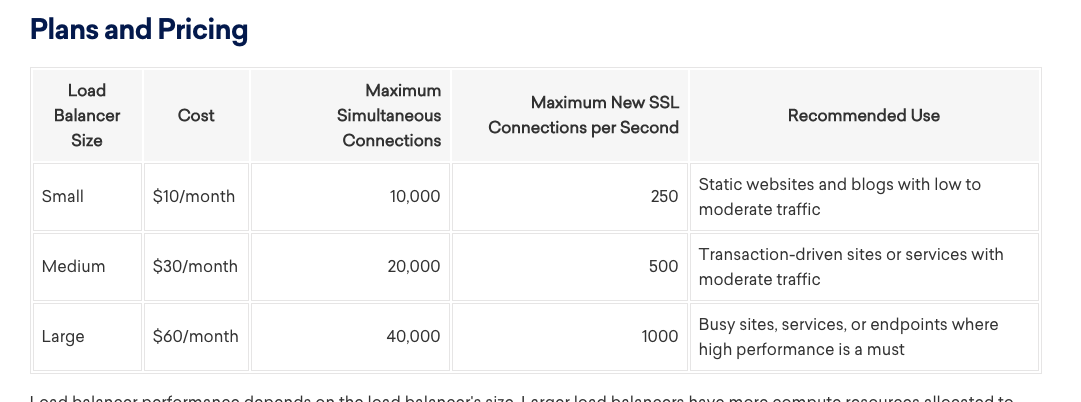
So 413rps vs 7351rps, that’s an order of magnitude! I could not get more than 2000 rps from DigitalOcean’s networking infrastructure, even tried their most expensive load balancer.

droplet-1 $ ./wrk --latency -t3 -c300 -d20s 'http://MY_DROPLET_IP/api/listing'
Running 20s test @ http://MY_DROPLET_IP/api/listing
  3 threads and 300 connections
  Thread Stats   Avg      Stdev     Max   +/- Stdev
    Latency    38.38ms   94.40ms   1.40s    96.61%
    Req/Sec     4.23k   515.62     5.01k    81.50%
  252290 requests in 20.03s, 376.54MB read
Requests/sec:  12595.20
There’s some throttling when i hit nginx from outside. Load testing nginx for a static file outside digital ocean gives only 700 rps:
aws-ec2-1 $ ./wrk --latency -t10 -c300 -d30s 'http://MY_DROPLET_IP'
Requests/sec: 642.61
Transfer/sec: 6.84MB
Load testing from the droplet itself::
MY_DROPLET_IP $ ./wrk --latency -t3 -c300 -d10s 'http://10.120.0.10'
Running 10s test @ http://10.120.0.10
  3 threads and 300 connections
  483768 requests in 10.04s, 722.02MB read
Requests/sec:  48176.13
From a droplet in another region:
root@milanLoadTest:~# ./wrk --latency -t10 -c300 -d30s 'http://138.68.235.33/index.html'
Running 30s test @ http://138.68.235.33/index.html
  10 threads and 300 connections
  Thread Stats   Avg      Stdev     Max   +/- Stdev
    Latency   704.66ms  224.93ms   2.00s    90.89%
    Req/Sec    44.66     29.67   290.00     73.40%
  12426 requests in 30.05s, 132.32MB read
Requests/sec:    413.54
Conclusion: DigitalOcean has a serious throughput limit.
No parts of this post have been written by AI.
